AI Business Intelligence Dashboard
The problem
Managerial decision-making was slow due to reliance on analysts to cross-reference sales data and generate static reports.
The solution
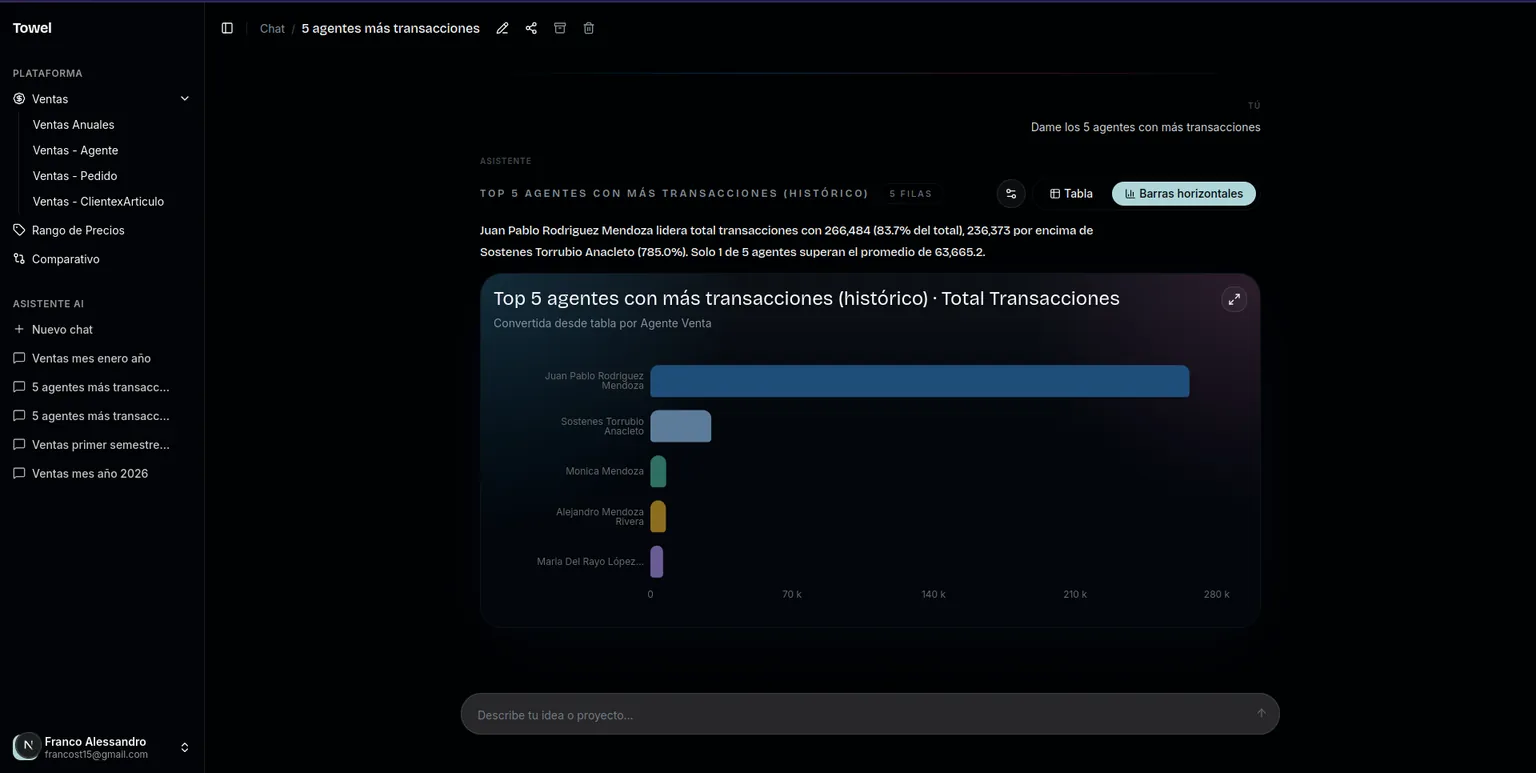
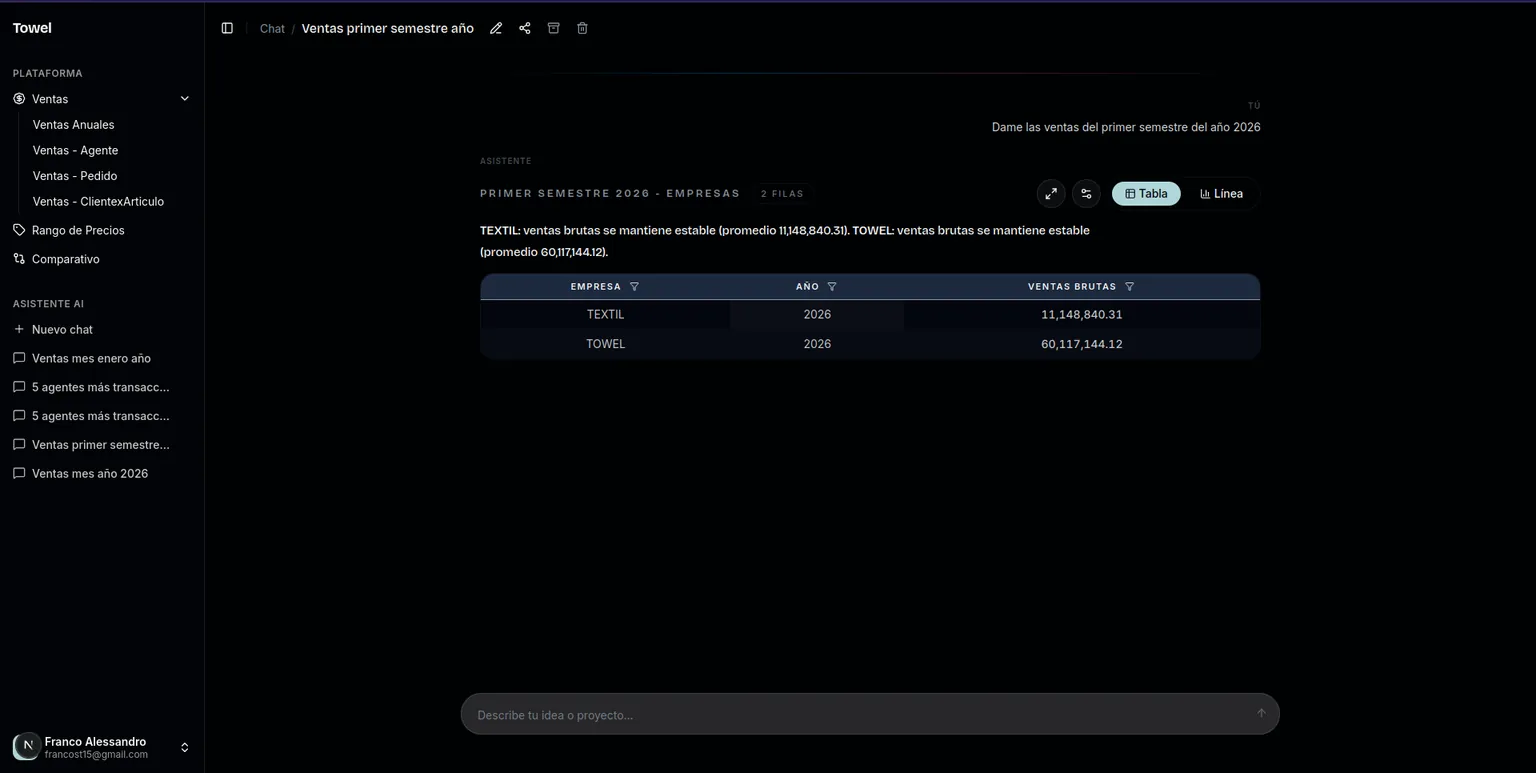
Interactive dashboard with an autonomous agent (LangGraph) capable of querying the SQL database in natural language, predicting sales, and generating dynamic charts instantly.
Architecture
React front end on PostgreSQL. A LangGraph graph orchestrates SQL and chart tools: the user writes in Spanish, the agent plans, runs parameterized reads, and returns a figure. The LLM is not glued to a raw SQL string; tools expose allowed operations. The same store feeds the plant ERP.
How it was measured
Operator-reported by the sole dashboard engineer at Towel S.A. de C.V., Oct 2025–present. Compared time to assemble the weekly sales report before (manual export and join) with time to ask the agent and render the chart. Not a controlled study; no third-party audit.
How does a manager query sales without waiting on an analyst?
They type the question in the dashboard. A LangGraph agent uses parameterized SQL and chart tools on PostgreSQL and returns the figure. The analyst is no longer the bottleneck for the weekly report.
The work
Towel S.A. de C.V. is a textile manufacturer in Puebla. Before this work, a manager who wanted sales crossed with production asked an analyst for a report. The analyst exported, joined tables, and returned a static slide. If the question changed, the cycle started again. That is not a “more charts” problem. It is a problem of who is allowed to ask and how long the answer takes. Friday became a mini-project. By Monday the figure was history.
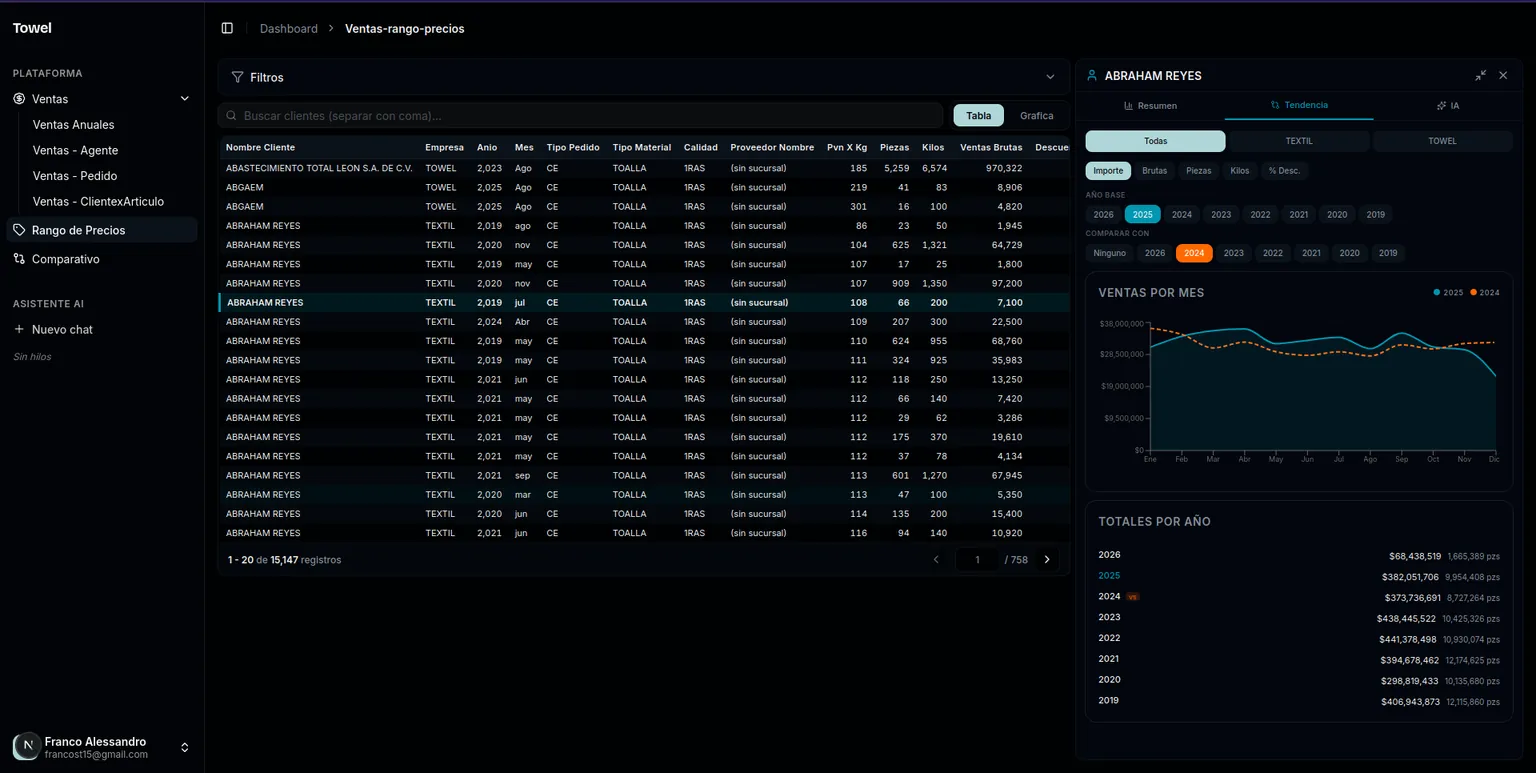
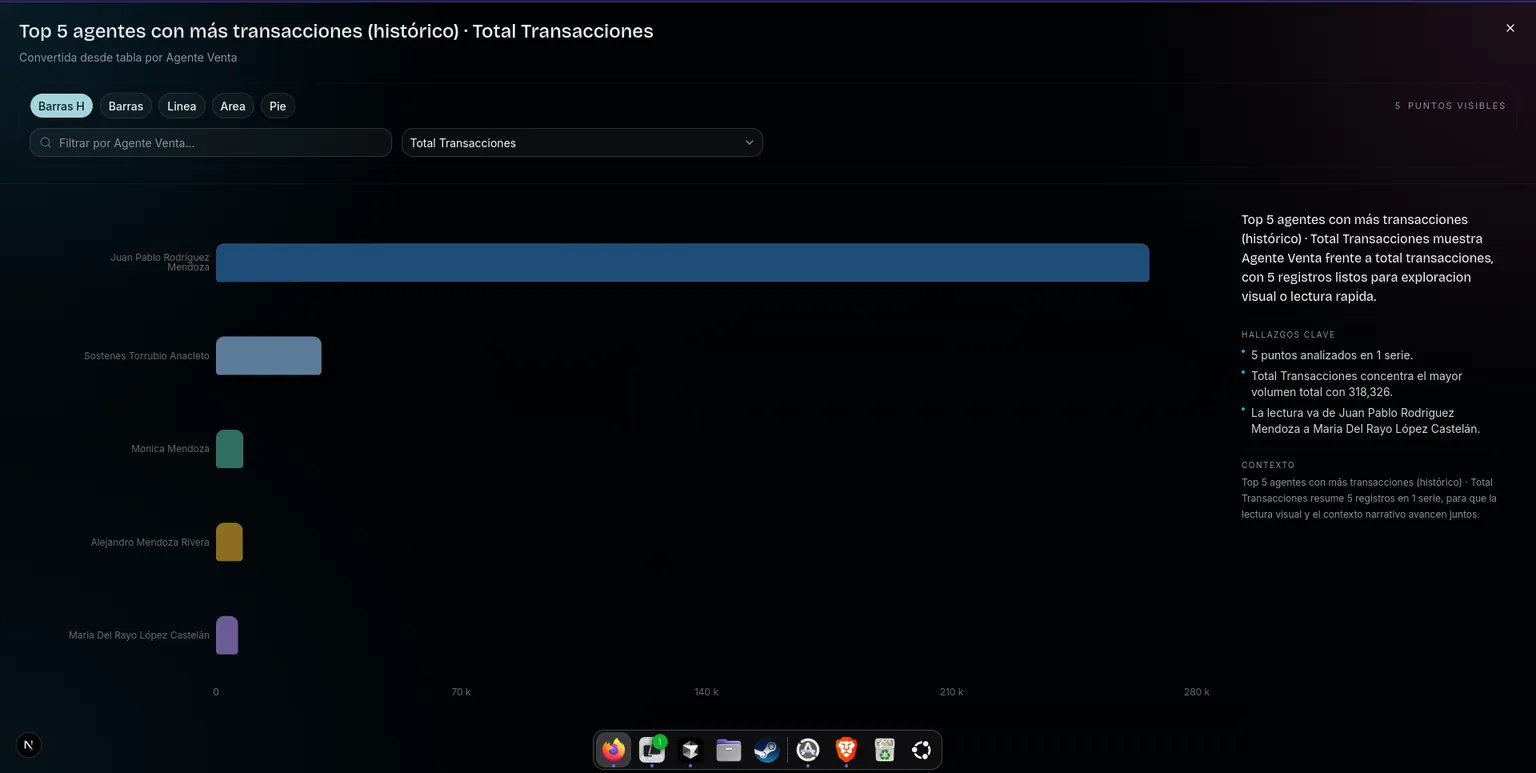
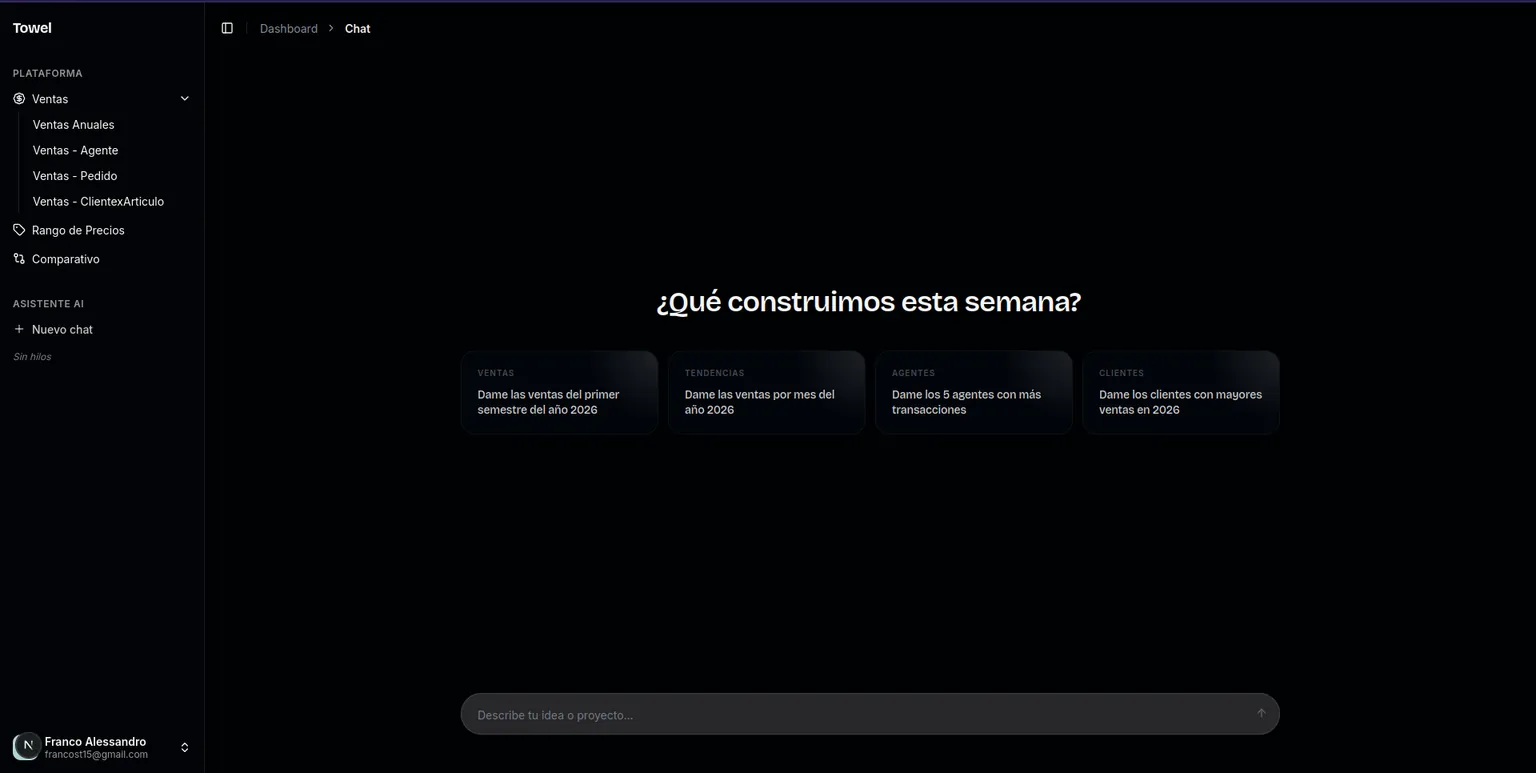
The system I built is a React dashboard that talks to PostgreSQL through a LangGraph agent. The user types in Spanish. The graph decides which tool to call: a parameterized SQL read, not string concatenation, and a chart tool that draws the result. The model does not have a free path to the schema; it sees operations I exposed. That is deliberate on a plant floor, where a malformed query is not a blog incident. It is a misread inventory. Each new tool is a product decision: either the question will recur, or it is answered once and forgotten.
The same store feeds the shop-floor ERP. Dashboard and ERP are not two marketing products. They are two faces of one record. If the floor loads stations and materials, management can ask about those figures without a second “BI” warehouse. Sales forecasting is a model on that history, not a disconnected widget. When the floor and management argue, they argue the same number.
I owned the work end to end: modeling, agent tools, UI, and the judgment of which question deserves a new tool versus a one-off report. There was no separate data team. I have been at Towel since October 2025; the dashboard is still in use because the weekly report stopped being a Friday project. The screenshots on this page are that UI, not a mock.
What it is not: a public SaaS product, a demo notebook, or an LLM with unrestricted production access. It is an internal, paid system. The operator who timed the weekly report before and after reported about a 90% drop in that time. That figure has no external audit. If a recruiter wants the method, it is on this page under “How it was measured.”
Screenshots